Sunday, August 31, 2008

The Flood on South Forest

Unfortunately, my first days back at the University of Michigan were tainted with some unfortunate occurrences. When I got back to Ann Arbor, I needed to turn my water back on. In order to do so, I had to go to the Ann Arbor City Council and pay them directly. Little to my knowledge, as soon as I paid for the water at the Ann Arbor City Council they turned it back on and the pressure forced all of the faucets in the house to open.

This ordinarily would not have been a problem, except for a single drain on the second floor that happened to be clogged. All of the other drains in the house were able to drain the water that was rushing into them fast enough so that it would not overflow. However, this one drain on the second floor obviously had some issues and therefore, water ended up overflowing from this drain and flooding the second floor.

If this wasn't enough, the water from the second floor then fell through to the first floor and then eventually to the basement below it. As a result, our house has had to undergo intense maintenance. They had to rip out the drywall and dry the inside of the house on the first floor due to concerns of potential warping of the wood in the interior of the house. Wood also takes a while to dry, so it has been a lengthy process, almost two weeks now.

However, what I was interested in, and the reason for me writing this post in the first place, was to explore the volume of water that caused all of this damage. It is really quite amazing to me that a job that will cost around $4,000 and has taken almost two weeks was the result of just a couple hours of not being at home. I wanted to know what volume of water created such damage.

Therefore, in this post, I intend to explore the amount of water that escaped the faucet on the second floor.
  • Results
In order to figure out the rate at which water was coming out the faucet, I went directly to the second floor bathroom and timed how quickly the water at full blast would fill a 2.2 liter container. I performed this task 11 times to get an average. I threw out the longest and shortest time that it took to fill the 2.2 liter container, which gave me 9 samples to average.

I found that the faucet at full blast takes 10.18889 seconds to fill a 2.2 liter container. In other words, the rate at which water leaves the faucet is equal to 0.21592 Liters per seconds. The rate is displayed graphically below.


The next step in the process was then to determine how long this occurred for. I went into the Ann Arbor City Council at around noon and then arrived home at 3pm. This means that three full hours passed before I got home.

Due to the fact that I won't ever truly know when they turned on the water, I'll assume that they did it as I paid for the bill, which was 11:49am and I'll assume I arrived home at 3:08pm, because I answered someone's text message at 3:03pm and said I would be back at the house "in five." This means that I was away from the house for 199 minutes total.

If we then understand that there are 60 seconds in a minute, all we have to do is multiply 199 minutes by 60 seconds, which equals 11,940 seconds total that passed.

With this information we can then find out the total volume of water that escaped the faucet in the 199 minutes (11,940 seconds).

If we take 11,940 and multiply this number by the rate of 0.21592 liters, we arrive at a total amount of 2,578.097 Liters (681.06 gallons). We can see the volume of water entering our house in Ann Arbor graphically by the graph below.


  • Conclusion
Overall, there was 2,578.097 liters that entered into my house on South Forest in Ann Arbor. This occurred over a span of 199 minutes and was the result of a single faucet that had a rate of 0.21592 liters per second.

To put this in perspective, however, at this rate, in order to fill up an Olympic-size swimming pool (2,500,000 liters), it would take 11,578,308 seconds which equates to 134 days.

Tuesday, August 26, 2008

The World in 2020

I recently ran a survey on my website, Those Answers, in which I intended to gain some insight into how people view various World issues and their potential status in the year 2020. The survey asked people about some of the most significant threats affecting the World, issues and people, the evolution of energy, corporate impact, and how to make a difference. I found the results extremely interesting.

The survey was taken by 47 individuals who ranged in age from 18 to 63. The average age of a respondent was 22.51 with a median of 21. Of those 47 individuals who chose to report their gender, 22 were male and 20 were female.

The rest of this post will be a graphical display of the results that I found, in addition to some of my thoughts as to why the results may appear as they are. I hope you enjoy.
  • Results
What is the greatest threat to humanity?
According to the results, Nuclear Weapons and Biological Warfare is the greatest threat to humanity and as we get closer to the year 2020, it will become a bigger problem. It was the only one of the choices available that had a higher percentage of respondents (40% vs. 49%) agreeing that it would be a greater threat in the year 2020.

I think that this choice is a rational one and most definitely something that needs to be addressed. Nuclear proliferation means that countries have the capacity to retaliate with weapons of mass destruction. At the push of a button cities can be destroyed.

Other threats to humanity that several respondents agreed upon were Poverty and Natural Disasters. Both of these issues show declining trends as the primary threat to humanity in the year 2020, which indicates an optimistic view of resolving the issues as well as confidence in the current measures in place.

Drugs and Alcoholism and Random Acts of Violence received a very small percentage of the total respondents primary threat to humanity. Additionally, Sexually Transmitted Diseases (STD's) was only seen as the greatest threat to humanity by approximately 10% of respondents. STD's like HIV/AIDS, herpes, or gonorrhea affect millions of people around the World, and I found it surprising that people didn't consider this a very big threat, even when compared to Nuclear Weapons, because it impacts so many people already, whereas, the use of Nuclear Weapons is not even a reality aside from the bombings at Hiroshima and Nagasaki at the conclusion of World War II.

63.8% of respondents maintained their choices from the year 2008 to 2020. This implies that some of the greatest challenges already facing the World today will still be of primary concern in the year 2020.

Who/What is the most dangerous force on the planet?
The most dangerous force on the planet was determined to be the US President. This was a surprising find in my opinion, and I can't really determine one thing in particular that would make this the case. I suppose the US president has enormous power militarily due to his (or her) ability to attack other countries and a massive collection of nuclear warheads. In many ways, the US President dictates World policy.

I was further suprised to see the low percentage of respondents that believed Mahmoud Ahmadinejad (Iranian President) was the most dangerous force (18%). Further, the percentage of people who believe Osama Bin Laden (14%) and Kim Jong-Il (7%) combined was less than the percentage of people who believed the President of China was the most dangerous person in the World (23%).

What resource will be most depleted by 2020?
According to the results of this survey, the most depleted resource by 2020 will be Clean Air. This is by an overwhelming margin as well. Its closest competitor was Drinkable Water which lagged behind by 23%. This was followed by Arable land with 20% of the respondents votes and finally Agricultural Produce with 9%.

Clean air is becoming an enormous problem, especially as the World population continues to grow at an exponential rate and as cities around the World become more densely populated. A McKinsey Global Institute report on China in 2025 indicated that the air quality in several Chinese cities could become noxious and unbearable due to pollution.

According to the McIlvaine Company, the air pollution reduction market will grow by an approximate rate of 17% compounded annually through 2015, becoming a $20+ billion per year industry.

I think that our respondents are spot on with their assessment of this particular issue.

Between 2008 and 2020, what energy resource will be most utilized?
The energy resource most utilized by 2020 was spread out and indicates the uncertainty of the alternative energy market as it stands currently. There are several alternatives and based on the even spread by respondents, it appears as though there is no clear sign of which alternative energy resource will be used most.

Leading the charge was Solar Energy, Ethanol, and Coal. I think that all of these show significant benefit and means to channeling resources away from Petroleum. Coal will most definitely be used in greater excess, as the United States has the most significant World share at 27.1% (Source).

I was surprised about the low amount of respondents who chose Environmentally Friendly Biofuels, as I am a huge proponent of them. I think that this type of fuel uses resources most effectively while also being least harmful to the environment overall.

Which country will have the highest per capita GDP by 2020?
The country that is projected to have the highest per capita GDP by the year 2020 was China. They received 49% of the votes. China was followed by the United States with 28% and Japan with 15%.

The question asked was about per capita GDP, which gives an idea as to the personal wealth of an average individual in a particular country. This does not necessarily relate to total GDP, which can be massive for a country, but when looked at through the scope of each person, may become very small.

That is why the choice of China by such an overwhelming percentage is surprising. Accordining to the Wikipedia article of Per Capita GDP, China currently ranks 99th according to the IMF, and 105 according to the CIA. This essentially means that an individual in China compared to the rest of the World is poorer than around 100 nations. While China will probably have the highest overall GDP by the year 2020, their per capita results are dismal.

The United States is currently ranked 6th by the IMF and 8th by the CIA. This makes sense when you think about a common person in the United States versus a common person in China. The standard of living is far higher for the average individual in the United States.

Small percentages went to Saudi Arabia and the United Arab Emirates even though they are both ranked far higher than China (Saudi Arabia = 37 & UAE = 15).

What industry shows the greatest potential for growth through 2020?
By an overwhelming margin, the industry that shows the greatest potential for growth through 2020 was determined by the respondents to be Alternative Energy with 67% of respondents agreeing. This was followed next by Information Technology, 19%, and Financial Services and Energy tied at 6% each.

Even though it is the dawn of the information age, people are overwhelmingly agreeing with the fact that alternative energy will trump technologies rise in the coming decade. These results may be skewed by the current situation with oil prices, yet, they are not unfounded as these issues need to be addressed.

The need to seek out Alternative Energy goes hand-in-hand with the fact that people are conscientious about the environment.

Which of the following corporations will have the greatest impact through 2020?

There are two prominent corporations that were chosen by the respondents that will have the greatest impact through 2020, and the results relate to the emerging industries over the next decade. The highest percentage was given to Exxon, 40%, but was closely followed by Microsoft with 36%.

These two companies are metaphors for energy and information technology, and it makes sense that they would be most prominently chosen.

There were several companies that received no votes by respondents at all. McKinsey & Company received 0% of the votes, which raises questions about the value of service industries. Caterpiller received 0% of the votes, which raises questions about the value of construction, and 3M received 0% of the votes, which raises questions about innovation and development of newer technologies not only related to information.

How do you tackle complex World issues?
Finally, respondents were asked how to tackle complex World issues. This was intended to give insight into how people think some of the problems that were discussed in the survey are best dealt with. Most people, 36%, believe that tackling complex World issues are done by use of Grassroots Movements. This essentially means that things are started locally and expand from there. This was in stark contrast to Governmental Intervention that received 17% of the votes by respondents.

Following Grassroots Movements, respondents also believed that a Societal Paradigm Shift, 30%, was the most effective way of tackling complex World issues. This means thinking in a new way about issues, and in this context, it means an entire society agreeing to think a new way about something.

For instance, I can see this beginning with LED (light emitting diode) lights versus incandescent lights. People are all starting to change their light bulbs due to energy and environmental concerns. It just takes a long time, but it is very effective.

Thoughts?

There was a final area where respondents could write down their thoughts if they wanted. Some people wrote that they enjoyed the survey, which was very nice feedback. A lot of people made reference to how the survey was vague or too general, or that I left out certain "issues."

The fact is that I was just trying to take the temperature of perspectives on the year 2020, not necessarily make a full blown diagnosis. Additionally, the year 2020 is very far away, and it's hard to be specific about something that is so distant.
  • Conclusion
The results of the survey are compelling and interesting. I think one of the most interesting things to note about the first couple of questions asked relating to threats, both issues and individuals, is that most people worry about problems that aren't even a reality, and forget about those already afflicting us.

While Nuclear Weapons are scary, poverty, sexually transmitted diseases, and random acts of violence affect people every day, and impact most likely 2/3 of the World's population.

We need to keep perspective on issues that are already needing our resolve.

Alternative energies are springing off in so many directions at the moment that it is hard to tell which will be most utilized. The varied choices by respondents indicate the lack of direction.

While most people believed China to have the greatest per capita GDP by 2020, they will probably be alarmed to realize that China ranks 99th in the World when it comes to per capita GDP. Just because a country as a whole makes a lot of money by volume doesn't necessarily mean that its average inhabitant is reaping those benefits. With 1.3 billion people it would make sense for China to have the highest total GDP, but we have to remember how that wealth is spread amongst that enormous amount of people.

Finally, of the respondents surveyed, 23 of them believed that "The World will be a 'better' place than it is in 2020 than 2008." This represents exactly 50% of the responses for this question, revealing that the other 50% of respondents do not believe the world will be a "better" place in 2020.

This is unfortunate split, as most respondents were in their early 20's, and at the start of their independent lives. One would hope that the younger generation remains idealistic and optmisitc about the future, because in the year 2020, it is a majority of this survey's respondents who will be combatting and trying to contribute solutions to the various issues raised in this survey. There are a lot of issues that need to be dealt with over the coming decade; that is for certain.

Tuesday, August 19, 2008

An Olympic Return

The Olympics are an incredible event that is hosted once every four years and it brings together nations from all over the World in friendly competition to measure human achievement. These Olympics in Beijing, China have seen some of the most impressive feats capable by all of mankind. Take for instance, Usain Bolt, who ran the 100 meter dash in 9.69 seconds blowing away the rest of the field and establishing a new World Record. How can you talk about the Olympics without mentioning Michael Phelps and his 8 gold medals in swimming? How about the impressive performances by US gymnasts Nastia Luikin and Shawn Johnson in the women's all-around competition.

After just 11 days of competition, I've been truly impressed by the Olympics and think that this one in particular will have significant long-term impact on the World and I feel like it is already changing it in just a short time.

Anyway, aside from the remarkable performances by the athletes and the most amazing opening ceremony probably in the history of the Olympics and perhaps the history of mankind, I wanted to delve into the financial impact that the Olympics has on the World. A huge reason why the Olympics have become the show that it has is due to large investments for big multi-national corporations around the World.

Take for instance the Olympic logo. In order to become an "official sponsor" of the Olympic games and therefore be able to market your company as such, it will cost approximately $50 Million. If companies don't want to spend this enormous amount of money over a 17 day span, they can also become a "partner" of the games in which they can display the logo of the Olympics in their marketing campaigns, but they will need to also put the "USA" or any other country along with it. This typically will cost companies around $25 Million.

As you can see there is a significant investment that companies who decide to involve themselves in the Olympic games undertake. However, it really wouldn't make much sense for these companies to spend exorbitant amounts of money if there weren't any payoff involved.

Intuitively, it makes good sense to sponsor an event like the Olympic games. For example, sponsors get an enormous amount of global reach in their advertising campaigns during the course of the games. This is true of television commercials, internet advertising, as well as, advertising at the Games themselves. This gives companies a great deal of exposure to a World market.


Additionally, the advertising campaign makes sense if you believe that advertising actually works. What I mean by this is that the Olympic games are a fun event that people have positive connotations connected with it. By linking those positive connotations of the Olympic games with the corporation that decides to sponsor the games, people become more likely then to associate positive images with a particular corporation. Ultimately, this is intended to drive revenues and eventually increase profits.

Increasing profits is the name of the game and Olympic sponsorships are a huge investment and it would thus only make good sense for companies to back this event if it ends up benefiting the company.

Therefore, I did an analysis of the 2004 Summer Olympics held in Athens, Greece and looked at 9 companies in particular that sponsored the games. Each company were primary "official sponsors" in varying categories. I looked at various financial indicators since 2004 through 2008 including their revenues, EBITDA, stock price, current ratio, and leverage ratio. I wanted to evaluate whether an Olympic sponsorship effort had any significant return or increase in growth over subsequent years.

In order to do so, I compared my 9 companies that sponsored the 2004 Summer Olympic games in Athens, Greece with 48 of the top 50 Fortune 500 companies in 2008. I consider these companies to be a sufficient benchmark on which to gauge economic progress.
  • Methods
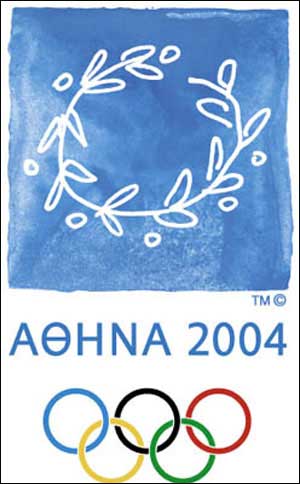
The first thing I decided was which Summer Olympics to look at in particular. I chose the 2004 Athens, Greece games, because I think that the sizable investment that companies have to make in sponsoring the games ought to have quick returns, defined as those that significantly impact financial data of a company within 4 years.

Next, I found the companies that sponsored the Summer Olympics in Athens, Greece. I found a website called, INVGR.com (Invest in Greece), which itemizes the companies that sponsored the Olympic games in Athens. According to the website, the sponsors invested over $600 million in the games.

Based on this list, I then picked companies that were publicly traded and had readily available financial data. This ended with our current list of 9 companies and their category which include:
  1. Hellenic Telecom (Telecommunications)
  2. Heineken (Brewery)
  3. Coca-Cola (Non-alcoholic beverages)
  4. Kodak (Film/photography and imaging)
  5. McDonalds (Retail Food Services)
  6. Samsung (Wireless Communications)
  7. Time Warner (Periodicals/Newspapers/Magazines)
  8. Xerox (Document Publishing, Processing, Supplies)
  9. Shell (Petroleum Products)
After determining these companies, I then looked up their financial data since 2004. All financial data is courtesy of Google Finance and all stock quote information is courtesy of Yahoo! Finance. Samsung's financial data was taken directly from their Annual Reports for 2004 through 2007.

The financial data includes measures for the current ratio of each company and leverage ratio for each company. The current ratio is found by dividing the current assets by the current liabilities and is a measure of a company's ability to pay its short term liabilities and its capacity to turn products to cash. The leverage ratio is a measure of the financial leverage of a company and gauges its ability to meet financial obligations. This ratio is found by dividing total assets by equity.

After performing the initial analysis of Olympic Sponsor companies, I then needed to benchmark my results against an average. I decided to use the top companies in the Fortune 500 List as my benchmark because of its inherent diversity of companies. In addition, the companies on the Fortune 500 list typically perform well and if I wanted to see if companies perform unusually well this would be a good group to compare it against.

I took the top 50 companies of the Fortune 500 List in 2008 and compared their revenues and stock prices since 2004. My sample included only 48 of the top 50 companies due to mergers and acqusitions that had occurred since 2004. I decided to leave these two companies out, because the merge may have inflated or slowed growth.
  • Results
  • Compound Annual Growth Rate (CAGR) Revenue
Since 2004, the 9 companies that sponsored the 2004 Athens Summer Olympic games had an average CAGR of 5.4%. The company with the highest CAGR was Samsung. Their CAGR was 17.7% and went from revenues of $55.2 billion in 2004 to $106.0 billion in 2007. The company with the lowest CAGR was Kodak. Their CAGR was -6.6% and went from revenues of $13.5 billion to $10.3 billion.

Compared to our benchmark of the top 48 of 50 companies in the Fortune 500, these results are dissapointing. The Fortune 500 companies had an average CAGR of 11.0% since 2004. The company that had the highest Revenue CAGR since 2004 was The Goldman Sachs Group, 30.1% and went from revenues of $23.6 billion to $88.0 billion. The company with the lowest Revenue CAGR since 2004 was General Motors, -1.4% and went from revenues of $195.6 billion to $182.3 billion.

Additionally, if we evaluate each sample's standard deviation we can determine a range in which we would most likely find 68% of the companies in each sample by looking at +/-1 standard deviation.

The Olympic sample had a standard deviation of 6.3%, which determines a range for Revenue CAGR for companies sponsoring the Olympic games as between -1.0% and 11.6%. The Fortune 500 sample had a standard deviation of 7.5%, which determines a range for their sample of 3.5% to 18.5%.
  • CAGR Stock Price
Since 2004, the 9 companies that sponsored the 2004 Summer Olympic Games in Athens had an average CAGR for their Stock Price of 7.5%. The best performing stock was McDonald's which had a CAGR of 17.9% and the worst performing stock was Kodak who had a CAGR of -5.4% for their Stock Price.

The top 48 of 50 Fortune 500 companies had an average CAGR for their Stock Price of 7.1%. The best performing stock was Valero Energy which had a CAGR of 35.6% and the worst performing stock was The Ford Motor Company who had a CAGR of -12.9%.

To determine a range in which we would most likely find 68% of our sampled companies we take a look at standard deviations. The standard deviation for the sponsoring companies was 8.2%, which defines a range of -0.7% to 15.7% CAGR for stock price. The standard deviation for the Fortune 500 companies was 10.1%, which defines a range of -3.0% to 17.2%.

For further comparison, we can look towards three widely used indeces in the United States Stock Exchange, the Dow Jones Industrial Average (.DJI), NASDAQ (.IXIC), and S&P 500 (.INX). Since 2004, the Dow Jones Industrial Average has had a CAGR of 3.8%, the NASDAQ has had a CAGR of 3.0%, and the S&P 500 has had a CAGR of 4.0%.

  • CAGR EBITDA
CAGR for EBITDA was only evaluated for the sponsoring companies. On average, the group's EBITDA had a CAGR of 2.9%. The highest performing company in terms of EBITDA was Time Warner, who achieved a 12.0% CAGR for EBITDA. Time Warner went from an EBITDA of $6.1 billion in 2004 to $9.6 billion in 2007. The worst performing company in terms of EBITDA was Kodak at -22.0%. Kodak went from an EBITDA of -106 million to -235 million.

  • Revenue Percentage Growth and Year over Year
The 9 sponsoring companies of the 2004 Summer Olympic Games grew on average by 7.5% from 2004 to 2005, 5.7% from 2005 to 2006, and 8.7% from 2006 to 2007. Between 2004 and 2006, Samsung grew the most each year. In 2006 to 2007, Coca-Cola had the highest percentage growth in revenues. Kodak was consistently the company that performed the worst from 2004 to 2007. Aside for a -0.1% growth by Xerox between 2004 and 2005, Kodak was the only company that had negative growth over this period.

By keeping the 2004 revenue of each company constant, it can give an idea as to how much the company grew over the four year period. On average for the group, revenues increased by 7.5% in the first year, by 14.4% by the second year, and by 25.2% by the third year.
  • Current and Leverage Ratios
In order to evaluate current and leverage ratios it is best to take a look at them as they deviate over the four sampled years. Overall, the average for the group's current ratio deviated by 0.146. The largest deviation in Current ratio was 0.491 by McDonalds. The smallest deviation was by Shell which was 0.079. The average current ratio for the 9 sampled sponsor companies over the four year period was 1.20.


The average deviation for leverage ratios was 0.515. The largest deviation was by Kodak, 2.912, and the smallest deviation was by McDonalds, 0.046. The average leverage ratio for the 9 sampled sponsor companies over the four year period was 2.83.


  • Conclusion
Companies will pay a tremendous amount of money in order to sponsor the Olympic games. Marketing campaigns and rights to the Olympic rings can cost in excess of $50 million. With such a large investment, it would seem strange for companies to not profit from it.

Based on the financial research of 9 sampled companies that sponsored the 2004 Summer Olympic games held in Athens, Greece, there is no significant benefit to sponsoring the Olympic games.

In terms of revenues, it appears as though those companies that sponsored the Olympic games actually lagged behind. Olympic sponsors had a CAGR of 5.3% since 2004, whereas the benchmark for this research (48 of the top 50 Fortune 500 companies) had a CAGR of 11.0%. This would suggest that the investment in the Olympics is unfounded.

However, when comparing stock price CAGR, Olympic sponsors outperform the benchmark slightly, 7.5% versus 7.1%. This, however, is very close and shouldn't be seen as a significant difference. EBITDA gains for sponsoring companies, 2.9% CAGR, further indicates the lack of impact that the Olympics has on the profitability of a company.

Current and Leverage ratios practically stay in line and there is no significant jump in these financial categories.

However, it is interesting to note that companies that invest in the Olympics typically have a strong stock return. As of January 1, 2008 the 9 sampled companies were up 50.8% on average, with the highest returners, McDonalds and Hellenic Telecom, up 127.5% and 117.4% respectively. It is also important to point out how companies who sponsor the Olympics have strong revenue growth. Although our sampled group didn't outpace our benchmark, the revenue growth after four years (without Kodak) is on average 31.3% with the highest growth coming from Samsung, 91.9%, Coca-Cola, 32.7%, and Shell, 33.6%. These are extremely strong numbers and 6 out of 9 companies had in excess of 20% revenue growth.

It's important to remember the larger picture and purpose of the Olympics in general. It's a momentous occasion that brings together the finest athletes in the World to compete together and promote good-will. Companies have the opportunity to benefit from the immense audience that is drawn to the Olympics, but there is certainly no proven formula.

Monday, August 11, 2008

Alternative Modes of Transport: Bus

Several weeks ago, I ran a survey relating to modes of transport between Ann Arbor and Chicago. The impetus for this survey was the result of the spiking oil prices, which have receded since then, but are still staggeringly high. Oil has been creeping up for quite some time. Starting from October of 2007, when oil was $92/barrel, the vast increase started to alarm people (Source).

Since then, it has topped out at $141.71/barrel on June 27, 2008. This is the highest price that oil has ever reached, even in real and inflation-adjusted terms. As of today, August 11, 2008 the NYMEX Crude Futures are at $114.68/barrel, a decrease of 19.1%. With this extreme spike in oil prices has come a lot of other baggage along with it.

For instance, while oil was spiking the economy was also dealing with the ongoing subprime mortgage woes that have truly and utterly paralyzed the American economy in my opinion. The growth outlook for the rest of 2008 is projected to be 0.7%, which is a snails pace when you consider the long term growth trends of the US Economy, and especially now when it is trying to keep stride with China and the growing World economy.

Additionally, the rise in oil prices have effected all things from apples to transportation. The price of food has increased along with oil prices, and transportation costs have spiked because they are linked to oil prices, which has meant that all goods that need to be transported (and that's pretty much everything you consume unless you go to the Farmer's Market in Aurora, Illinois) have risen with it.

Increasing oil prices are never a good thing and compounded on the rest of the economy's troubles, this hasn't been the best economic years in recent time for the American economy.

However, with every cloud there is always a silver lining (or at least I remember hearing that in Kindergarten and I hope and pray that this adage holds up). With rising oil prices, one of the major shifts that could occur is in how people commute. National gas prices for a gallon were in excess of $4 at one point, and this severely hurt demand. For the first time in many registered years, the demand for oil in the US declined as a result of the high price of oil. For the first time this century, OPEC has projected a decline in demand for oil by the year 2020 according to their 2008 World Oil Outlook.

People are simply not driving as much, because they just couldn't afford it. It made sense to me that if people weren't going to drive their own vehicles, they would have to turn to some other means in order to get around (I assume that people are productive and will continue to get out of their homes even if they can't drive their own cars).

So, in order to make this idea a little more tangible for me, I broke it down to a lengthy commute that I typically go on and wondered if people would change their habits due to the rise in oil. I wanted to see whether people would consider taking a bus as an alternative mode of transportation from Chicago to Ann Arbor, where the University of Michigan is, or vice-a-versa.

I often perform this commute. It takes about 4 and a half hours to get from one place to the next and its a pretty simple and easy drive to do. However, with the rising oil prices, the cost of the journey each way was amounting to around $54 (I'm assuming a car that can go 20 miles per gallon at a rate of $4.50/gallon). Anyway, that's a lot of money to have to pay, and that only gets you there. You have to pay another $54 on the way back. So a trip from Chicago to Ann Arbor is going to cost the average person $108 automatically.

There's got to be a better way. That led me to think about alternative modes of transportation. I was immediately led to the idea of starting a bus service that goes between Ann Arbor and Chicago. I hadn't really heard of too many before and I thought the idea to be quite novel. Since thinking this idea up, however, I have come to learn that bus services between Ann Arbor and Chicago is not only plentiful with different bus services but also highly competitive. It was a great idea in principal, but its already been explored. However, I wanted to see what people's propensity towards alternate modes of transportation were as a result of the rise in the price of oil.
  • Results
I received 17 respondents for this survey. Therefore, I can't call my results statistically significant, but I like to consider them at least an indication of what people may generally do.

The respondents were composed of 10 males, 6 females, and 1 unknown. The average age of respondents was 24 years of age with a mode of 21 years of age.

I first wanted to gauge how many times people actually frequented Chicago from Ann Arbor during a typical school year. Therefore, I asked them how many times they made the trip in a given school year. The average amount was 2.25 times, with a median of 1.5 and a mode of 1. The most times a person traveled to Chicago was 6 times, and the least amount was 0 (answered by 3 different respondents).

The following graph indicates how these people who traveled to Chicago typically get there. As you can see a number of them Drove there, 80%, and the rest of the 20% was split between bus and train. I find it surprising that none of the respondents replied that they take the plane to Chicago. I realize that the journey is only 4.5 hours by bus, train, or drive, but I have taken a plane in the past and its quite pleasant and very fast.

I then wanted to gauge how the price of oil had affected peoples habits in their everyday lives and how it had specifically affected their mode of transport. According to my results, only 6 out of 17 people had had the price of oil affect any of their spending habits. Quite similarly, the proportion of people who responded "yes" to the rise in oil affecting their habits as they relate to their mode of transportation, 7 out of 17 people, agreed that the price of oil was affecting their habits of transportation.

When I first considered these proportions, they didn't seem all that significant, but both are very indicative of the climate and the present state of the economy. I would contend that people don't typically think about the price of oil when they're picking out their Cheerios at the grocery store, or buying a song on iTunes, but apparently that is the case with 6 of 17 of our respondents. Even more significant, is the fact that 7 out of 17 people have changed their habits when it comes to modes of transportation to accommodate the rise in oil prices. If humans are creatures of habit, oil is mighty powerful in changing those habits.

I also wanted to know what price it would take for people to change their spending habits (if they hadn't already). My results indicate that at a price of $5/gallon (mode), people's habits would most likely change when it came to their respective modes of transportation. Our oil prices came very close to making that number a reality, but as of right now they are most certainly on the retreat, and I believe the national average has dropped well below $4/gallon.

I then gauged whether or not people believed that as prices continued to increase for a gallon of gas, if "alternate methods of transport would actually become a realistic alternative to driving their personal vehicle." My results indicate that 10 out of 17 people believe this to be the case. That is a solid majority, and although these results are statically significant, that is an interesting idea to say the least.

Finally, I presented the respondents with a scenario in which I asked them to consider going to a location called Zanzibar, which was a mere cover for Ann Arbor from Chicago (I'm sneaky). The trip was planned on short notice, and I provided them with time, distance, and cost variables for plane, train, and bus. I then wanted to see what most people would do considering these various constraints.

As it turns out, a huge percentage of people would opt for the bus. According to this study, 76% would take the bus, 18% would fly, and 6% would take a train. I find these results a little overwhelming. I want to attribute these results to bias, but I truly believe that if there was an affordable and enjoyable service that got people from A to B in the same amount of time as driving but at a cheaper cost, I really see no reason why they wouldn't go for it.

There are similar services in New York City that go from Washington, DC to New York or vice-a-versa, and that seems to do very well. It is a comparable distance between Ann Arbor and Chicago as it is from New York City to Washington, DC, and I have taken that bus and I enjoyed the ride.

I calculated that a competitive rate for a ticket from Ann Arbor to Chicago could cost anywhere in the range of $20-$30 for a one way ticket on a bus. I'm not sure what competitors are currently offering, but after factoring in bus rental (or lease), paying the driver, insurance, and cost of fuel, a pretty hefty margin can be attained if you charge a person $20-$30 each way. This kills the rate of $54 if you were to drive your own personal vehicle.

However, when giving the option of using one's own personal vehicle as the mode of transportation to Zanzibar, 9 out of 17 people still would opt to drive. This draws on the habit that people have to drive their cars to get around. There are definitely other ways though, and they can be a lot more cost effective, especially today when the economy is slumping and oil is going through the roof.
  • Conclusion
The results indicate that people would be willing to take a bus from Chicago to Ann Arbor in order to satisfy their transportation needs on short notice trips. I am not sure as to how this statistic would vary if time were taken out of the equation.

Although the bus became the number one choice of transportation, the advent of one's own personal vehichle still loomed and was far more widely accepted if given that as an option.

In order for people's transportation habits to change, the price of gas will have to soar to extreme heights, probably in excess of $180/barrel for oil and $5/gallon. The bus transport industry can be very effective and profitable if managed properly.

Saturday, August 9, 2008

The Standardization of Time

I've recently gained new and lasting respect for the power of time. I've come to realize that time is my most important and valuable commodity, because it is limited and ever-fleeting. I really started to gain a true appreciation for time when I was traveling around Europe. When I was over there, I realized that the things that I chose to do with my time were important and I had to choose carefully.

At any given moment, I could have decided to be in Prague, Amsterdam, Copenhagen, Budapest, or anywhere else. All I had to do was decide where to be and make it happen. Additionally, while being over there, I realized that no matter where I went, there was always something interesting and fantastic going on that I enjoyed and loved taking part in.

This indicated that no matter where I decided to be in the world at any given moment, I was going to have a great time, so the most important thing to decide was simply where to put my time.

It's a very empowering feeling to know that anything is possible. Anyway, I really feel like I have a greater realization of time and how important it is to my life.

Therefore, I wanted to write about the accomplishment of strandardizing time. I think about how many things a day that are contingent on me coordinating activities with other people, and I think that without a standardized method of discussing our places and locations in the universe (aka, time), then I'm not sure how productive or how much humans could get accomplished.

I think that much of the reason why humanity has progressed as it has over the past couple million years is due to the fact that we have not only figured out a very sophisticated and impressive linguistic understanding of one another, but we've also been able to coordinate our activities based on an agreed standardization of time.

Surely there will be counterarguments from people who can't understand the bigger picture of what I'm trying to convey. You may contend that people don't really agree on the standardization of time because of various things like daylight savings time, especially the case of Indiana in the United States. They didn't agree to daylight savings time until 2005, around 120 years after daylight savings time was first initiated.

However, when you consider humanity's entire existence and then fathom that we only began to think about standardizing time aroung 120 years ago, we most certainly have come a long way in just a couple years.

As for a little history lesson, standardized time in North America was the result of issues relating to train schedules. On October 11, 1883, the heads of the major railroads met in Chicago at the former Grand Pacific Hotel to adopt the Standard Time System. The new system was adopted by most states almost immediately after railroads did so and finally officially adopted by the U.S. government almost fifty years later.

In 2007 the United States enacted a federal law formalizing the use of Coordinated Universal Time as the basis of standard time, and the role of the Secretary of Commerce (effectively, the National Institute of Standards and Technology) and the Secretary of the Navy (effectively, the U.S. Naval Observatory) in interpreting standard time (Source).

Anyway, I feel like so much hinges on this ability of ours to coordinate activities. It makes us work together as a species, which has allowed us to progress rapidly and reap the benefits of this universe.

I think about how the whole world was watching the opening of the Beijing Olympic games last night. This event had been seven years in the making, and everyone knew exactly when and where it was going to be, even though in Chicago, Illinois (where I was), being thousands of miles away from it didn't make a difference.

I think about how I caught a train yesterday. I got there a little earlier than I normally do. I had to sit around for about an hour and a half before the first train came to where I needed it to go. What I found remarkable was that while I was sitting in the train station, for the first hour and twenty minutes before the train came, I was practically by myself. There was the odd person who walked through the train terminal, but for the most part I was just there sitting by myself.

However, within 10 minutes of the train arriving, hundreds of people began showing up. Their actions all coordinated by a simple time mechanism. It was no coincidence that all of these people showed up at the same time. They had all taken into account when they needed to be somewhere, and because humans have generally agreed on a standardization of time, hundreds of people could simultaneously coordinate their activities independently.

It just boggles my mind. Your time is special, use it the best way you know how.