 I recently ran a survey on my website, Those Answers, in which I intended to gain some insight into how people view various World issues and their potential status in the year 2020. The survey asked people about some of the most significant threats affecting the World, issues and people, the evolution of energy, corporate impact, and how to make a difference. I found the results extremely interesting.
The survey was taken by 47 individuals who ranged in age from 18 to 63. The average age of a respondent was 22.51 with a median of 21. Of those 47 individuals who chose to report their gender, 22 were male and 20 were female.
The rest of this post will be a graphical display of the results that I found, in addition to some of my thoughts as to why the results may appear as they are. I hope you enjoy.
- Results
What is the greatest threat to humanity?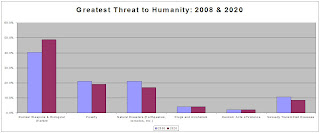

According to the results, Nuclear Weapons and Biological Warfare is the greatest threat to humanity and as we get closer to the year 2020, it will become a bigger problem. It was the only one of the choices available that had a higher percentage of respondents (40% vs. 49%) agreeing that it would be a greater threat in the year 2020.
I think that this choice is a rational one and most definitely something that needs to be addressed. Nuclear proliferation means that countries have the capacity to retaliate with weapons of mass destruction. At the push of a button cities can be destroyed.
Other threats to humanity that several respondents agreed upon were Poverty and Natural Disasters. Both of these issues show declining trends as the primary threat to humanity in the year 2020, which indicates an optimistic view of resolving the issues as well as confidence in the current measures in place.
Drugs and Alcoholism and Random Acts of Violence received a very small percentage of the total respondents primary threat to humanity. Additionally, Sexually Transmitted Diseases (STD's) was only seen as the greatest threat to humanity by approximately 10% of respondents. STD's like HIV/AIDS, herpes, or gonorrhea affect millions of people around the World, and I found it surprising that people didn't consider this a very big threat, even when compared to Nuclear Weapons, because it impacts so many people already, whereas, the use of Nuclear Weapons is not even a reality aside from the bombings at Hiroshima and Nagasaki at the conclusion of World War II.
63.8% of respondents maintained their choices from the year 2008 to 2020. This implies that some of the greatest challenges already facing the World today will still be of primary concern in the year 2020.
Who/What is the most dangerous force on the planet?

The most dangerous force on the planet was determined to be the US President. This was a surprising find in my opinion, and I can't really determine one thing in particular that would make this the case. I suppose the US president has enormous power militarily due to his (or her) ability to attack other countries and a massive collection of nuclear warheads. In many ways, the US President dictates World policy.
I was further suprised to see the low percentage of respondents that believed Mahmoud Ahmadinejad (Iranian President) was the most dangerous force (18%). Further, the percentage of people who believe Osama Bin Laden (14%) and Kim Jong-Il (7%) combined was less than the percentage of people who believed the President of China was the most dangerous person in the World (23%).
I was further suprised to see the low percentage of respondents that believed Mahmoud Ahmadinejad (Iranian President) was the most dangerous force (18%). Further, the percentage of people who believe Osama Bin Laden (14%) and Kim Jong-Il (7%) combined was less than the percentage of people who believed the President of China was the most dangerous person in the World (23%).
What resource will be most depleted by 2020?

According to the results of this survey, the most depleted resource by 2020 will be Clean Air. This is by an overwhelming margin as well. Its closest competitor was Drinkable Water which lagged behind by 23%. This was followed by Arable land with 20% of the respondents votes and finally Agricultural Produce with 9%.
Clean air is becoming an enormous problem, especially as the World population continues to grow at an exponential rate and as cities around the World become more densely populated. A McKinsey Global Institute report on China in 2025 indicated that the air quality in several Chinese cities could become noxious and unbearable due to pollution.
According to the McIlvaine Company, the air pollution reduction market will grow by an approximate rate of 17% compounded annually through 2015, becoming a $20+ billion per year industry.
I think that our respondents are spot on with their assessment of this particular issue.
Between 2008 and 2020, what energy resource will be most utilized?

The energy resource most utilized by 2020 was spread out and indicates the uncertainty of the alternative energy market as it stands currently. There are several alternatives and based on the even spread by respondents, it appears as though there is no clear sign of which alternative energy resource will be used most.
Leading the charge was Solar Energy, Ethanol, and Coal. I think that all of these show significant benefit and means to channeling resources away from Petroleum. Coal will most definitely be used in greater excess, as the United States has the most significant World share at 27.1% (Source).
I was surprised about the low amount of respondents who chose Environmentally Friendly Biofuels, as I am a huge proponent of them. I think that this type of fuel uses resources most effectively while also being least harmful to the environment overall.
Which country will have the highest per capita GDP by 2020?

The country that is projected to have the highest per capita GDP by the year 2020 was China. They received 49% of the votes. China was followed by the United States with 28% and Japan with 15%.
The question asked was about per capita GDP, which gives an idea as to the personal wealth of an average individual in a particular country. This does not necessarily relate to total GDP, which can be massive for a country, but when looked at through the scope of each person, may become very small.
That is why the choice of China by such an overwhelming percentage is surprising. Accordining to the Wikipedia article of Per Capita GDP, China currently ranks 99th according to the IMF, and 105 according to the CIA. This essentially means that an individual in China compared to the rest of the World is poorer than around 100 nations. While China will probably have the highest overall GDP by the year 2020, their per capita results are dismal.
The United States is currently ranked 6th by the IMF and 8th by the CIA. This makes sense when you think about a common person in the United States versus a common person in China. The standard of living is far higher for the average individual in the United States.
Small percentages went to Saudi Arabia and the United Arab Emirates even though they are both ranked far higher than China (Saudi Arabia = 37 & UAE = 15).
What industry shows the greatest potential for growth through 2020?

By an overwhelming margin, the industry that shows the greatest potential for growth through 2020 was determined by the respondents to be Alternative Energy with 67% of respondents agreeing. This was followed next by Information Technology, 19%, and Financial Services and Energy tied at 6% each.
Even though it is the dawn of the information age, people are overwhelmingly agreeing with the fact that alternative energy will trump technologies rise in the coming decade. These results may be skewed by the current situation with oil prices, yet, they are not unfounded as these issues need to be addressed.
The need to seek out Alternative Energy goes hand-in-hand with the fact that people are conscientious about the environment.
Which of the following corporations will have the greatest impact through 2020?


There are two prominent corporations that were chosen by the respondents that will have the greatest impact through 2020, and the results relate to the emerging industries over the next decade. The highest percentage was given to Exxon, 40%, but was closely followed by Microsoft with 36%.
These two companies are metaphors for energy and information technology, and it makes sense that they would be most prominently chosen.
There were several companies that received no votes by respondents at all. McKinsey & Company received 0% of the votes, which raises questions about the value of service industries. Caterpiller received 0% of the votes, which raises questions about the value of construction, and 3M received 0% of the votes, which raises questions about innovation and development of newer technologies not only related to information.
How do you tackle complex World issues?

Finally, respondents were asked how to tackle complex World issues. This was intended to give insight into how people think some of the problems that were discussed in the survey are best dealt with. Most people, 36%, believe that tackling complex World issues are done by use of Grassroots Movements. This essentially means that things are started locally and expand from there. This was in stark contrast to Governmental Intervention that received 17% of the votes by respondents.
Following Grassroots Movements, respondents also believed that a Societal Paradigm Shift, 30%, was the most effective way of tackling complex World issues. This means thinking in a new way about issues, and in this context, it means an entire society agreeing to think a new way about something.
For instance, I can see this beginning with LED (light emitting diode) lights versus incandescent lights. People are all starting to change their light bulbs due to energy and environmental concerns. It just takes a long time, but it is very effective.
Thoughts?
There was a final area where respondents could write down their thoughts if they wanted. Some people wrote that they enjoyed the survey, which was very nice feedback. A lot of people made reference to how the survey was vague or too general, or that I left out certain "issues."
The fact is that I was just trying to take the temperature of perspectives on the year 2020, not necessarily make a full blown diagnosis. Additionally, the year 2020 is very far away, and it's hard to be specific about something that is so distant.
While Nuclear Weapons are scary, poverty, sexually transmitted diseases, and random acts of violence affect people every day, and impact most likely 2/3 of the World's population.
We need to keep perspective on issues that are already needing our resolve.
Alternative energies are springing off in so many directions at the moment that it is hard to tell which will be most utilized. The varied choices by respondents indicate the lack of direction.
While most people believed China to have the greatest per capita GDP by 2020, they will probably be alarmed to realize that China ranks 99th in the World when it comes to per capita GDP. Just because a country as a whole makes a lot of money by volume doesn't necessarily mean that its average inhabitant is reaping those benefits. With 1.3 billion people it would make sense for China to have the highest total GDP, but we have to remember how that wealth is spread amongst that enormous amount of people.
Finally, of the respondents surveyed, 23 of them believed that "The World will be a 'better' place than it is in 2020 than 2008." This represents exactly 50% of the responses for this question, revealing that the other 50% of respondents do not believe the world will be a "better" place in 2020.
This is unfortunate split, as most respondents were in their early 20's, and at the start of their independent lives. One would hope that the younger generation remains idealistic and optmisitc about the future, because in the year 2020, it is a majority of this survey's respondents who will be combatting and trying to contribute solutions to the various issues raised in this survey. There are a lot of issues that need to be dealt with over the coming decade; that is for certain.
The fact is that I was just trying to take the temperature of perspectives on the year 2020, not necessarily make a full blown diagnosis. Additionally, the year 2020 is very far away, and it's hard to be specific about something that is so distant.
- Conclusion
While Nuclear Weapons are scary, poverty, sexually transmitted diseases, and random acts of violence affect people every day, and impact most likely 2/3 of the World's population.
We need to keep perspective on issues that are already needing our resolve.
Alternative energies are springing off in so many directions at the moment that it is hard to tell which will be most utilized. The varied choices by respondents indicate the lack of direction.
While most people believed China to have the greatest per capita GDP by 2020, they will probably be alarmed to realize that China ranks 99th in the World when it comes to per capita GDP. Just because a country as a whole makes a lot of money by volume doesn't necessarily mean that its average inhabitant is reaping those benefits. With 1.3 billion people it would make sense for China to have the highest total GDP, but we have to remember how that wealth is spread amongst that enormous amount of people.
Finally, of the respondents surveyed, 23 of them believed that "The World will be a 'better' place than it is in 2020 than 2008." This represents exactly 50% of the responses for this question, revealing that the other 50% of respondents do not believe the world will be a "better" place in 2020.
This is unfortunate split, as most respondents were in their early 20's, and at the start of their independent lives. One would hope that the younger generation remains idealistic and optmisitc about the future, because in the year 2020, it is a majority of this survey's respondents who will be combatting and trying to contribute solutions to the various issues raised in this survey. There are a lot of issues that need to be dealt with over the coming decade; that is for certain.


