 I'm continually fascinated by companies. I think that if you look close enough, you will find that they can be as unique and interesting as people. All of them have personalities of their own, however, that personality is constructed by the collective unit of people that work to move that company forward.
Companies have identities. A large portion of this identity is presented via the media, especially advertising and the news. So, in a sense, corporations are similar to celebrities. You see them on the news now and then. Once in a while they do something stupid that gets them in trouble. You typically don't get the opportunity to actually meet the CEO of the company or visit its headquarters.
So, if you enjoying keeping up with the life and times of Brad Pitt, Paris Hilton, George Clooney, or perhaps even Eva Longoria, realize that my passion when it comes to following companies is in the same context. I find the story that they tell and the impact that they have on the world equal to that of prominent movie actors and actresses in Hollywood.
In an attempt to learn more about companies and how people perceive some of the most notable companies, I recently ran a survey on Those Answers Inc. website.
The goal of my survey was to compare how corporations from a wide spectrum of activities in the United States economy were perceived. I looked at four separate criteria, each composed of two diametrically opposed descriptors, that I eventually plotted against one another in order to see if there was any correlation. The four criteria were:
- Success and Failure
- Knowledge and Ignorance
- Innovating and Stagnating
- Good and Evil
- Survey
There were 10 companies used in this survey. They were:
- Boeing

- Comcast
- CVS/Caremark
- FedEx
- General Motors
- Goldman Sachs
- Home Depot
- Microsoft
- PepsiCo
- Walmart
 Companies would receive a score of 5 points for being the "most" Successful, Knowledgeable, Innovating, or Good, gradually moving to -5 points for being the "biggest" Failure, Ignorance, Stagnating, or Evil. Between these two extremes, companies would score points between 1 and 4 points if closer to the Successful, Knowledgeable, Innovating, or Good side, and -1 and -4 points if closer to the Failure, Ignorance, Stagnating, or Evil side. The continuum did not include the score of 0.
Based on the respondents ranking of the companies points were assigned for each criteria. The points were then averaged. Finally, the points were then plotted against one another for the varying criteria to see if there was a correlation between the two.
 A correlation was determined by adding a trend line to the data that expressed and assisted in performing regression analysis. According to the Kellogg School of Management, "Regression analysis is a statistical technique for studying linear relationships." This type of analysis is beneficial, because it provides a goodness of fit for selected data points and compares two seemingly unrelated criteria that may indeed correlate to one another.
A further step is required. In order to determine the, "proportion of variability in a data set that is accounted for by a statistical model," a coefficient of determination needs to be assessed (Wikipedia). According to Duke University, a good value for the coefficient of determination is generally equal to or greater than 50%, but in most cases it just depends. We will make note of the coefficient of determination when presenting the results.
- Results
- Knowledge have a high correlation to Success
- Innovating have a high correlation to Success
- Good have a high correlation to Success
- Knowledge - Success


As you can see in the graph, there are many companies within the first quadrant (Microsoft, Boeing, Walmart) that are all considered both successful and knowledgeable. Then there are several companies within the third quadrant (Comcast, General Motors, Home Depot) that are all considered failures and ignorant (or less successful and less knowledgeable than their counterparts in quadrant I).
You may also notice a lack of companies in Quadrant II and IV. Companies falling within this range would represent highly knowledgeable companies that are failures and ignorant companies that are successes.
Intuitively, the results make sense and the coefficient of regression further warrants this. Companies that are considered "knowledgeable" ought to be "successful." If we draw on my analogy from the beginning of this post (companies are like people), one would also believe that a knowledgeable person would become successful. Companies that are not as knowledgeable are therefore not as successful. The lack of companies within the II and IV quadrant also further prove this correlation.
- Innovating - Success
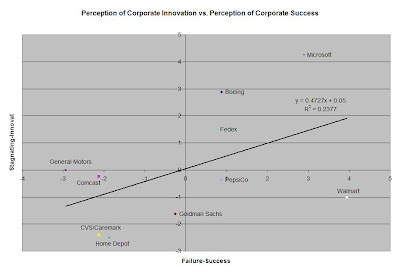

The reason that Innovation and Success may not be as strongly correlated is due to the fact that there is no direct link between Innovation and Success. Companies can be unbelievably innovative, developing new ideas everyday, but those ideas may not convert into revenue and ultimately profit.
In this scenario, there are companies that are seen as highly successful, Walmart and PepsiCo, but are stagnating at the same time. This is very accurate, especially when you look at the case of Walmart. While I would contend that Walmart's processes and supply chain integration are some of the most innovative in the world, as far as their product is concerned (consumer goods) they are relatively the same. This doesn't mean for one instant, however, that they are losing any bit of revenue or being any less of a successful company.
- Ethics - Success
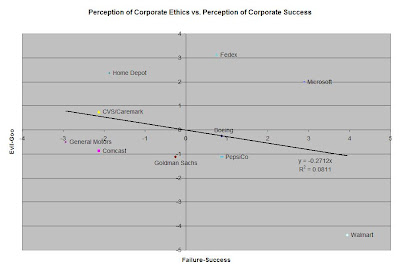

By looking at the chart, you can see that the companies are generally spread out showing no real signs of following any sort of linear relationship. This ultimately leads to a weak coefficient of determination.
You may also notice that even though the coefficient of determination is weak, the linear trend actually has a negative slope, indicating that the more successful a company is perceived to be the more evil it becomes. When one stands back and thinks about this correlation, it tends to make sense logically.
Consider highly successful companies; Walmart (#1 Fortune 500 List), Nike (Top Shoe Sales in the World), and Coke (#1 Soft Drink in the World). While all of these companies are considered extremely successful, they are also often questioned for their ethics and morality when it comes to how they treat their workers, smaller distributors, etc. Therefore, even though the trend isn't strong it makes sense.
- Innovation - Knowledge


Similar to our scenario of Knowledge - Success, companies are generally found within the First and Third Quadrant, indicating a link between innovation and knowledge and stagnation and ignorance.
Similar to our other scenarios, just by thinking about these two criteria logically it clearly makes sense that there would be a strong correlation between them. Companies that have a lot of knowledge probably have the ability to innovate well. At least, one's perception of corporate knowledge must lead to a belief in that company's ability to innovate.
The reverse is also true. Companies that innovate are probably thought to be very knowledgeable about their particular field, because they can continually adapt and work out new possibilities with it.
- Conclusion
Regression analysis was performed in order to evaluate coefficients of determination. The coefficient of determination indicated a value between 0 and 1, 0 being least determinant and 1 being most determinant.
Based on the findings of this survey, the correlation between Knowledge and Innovation was highest, 0.6436. This was then followed by Knowledge and Success, 0.603. These two figures meet our Duke University criteria of being greater than or equal to 50% and can be considered legitimate correlations.
Our two other studies, Ethics and Success, 0.0811, and Innovation and Success, 0.2377, fall short of the generally accepted standard, and therefore, I cannot deduce any sort of correlation between these two criteria aside from logic.
Overall, I thought this was a really interesting and enjoyable study to perform. I was surprised at how well the results actually turned out. I feel like I learned a lot about companies and some ways in which they relate.


No comments:
Post a Comment