Showing posts with label Stocks. Show all posts

Tuesday, June 2, 2009

Trading

Several weeks ago I ran a survey through Those Answers Inc. which sought to look at the correlation between a person's likelihood of investing in the stock market if they engaged in a market based system in their younger years, trading cards.

The first thing to address when tackling this question is to define what a market is. A market is merely just a conceptualized form in which one good or service is traded for another good or service. There are countless forms of markets in today's modern world. There are more formalized markets like the stock market or the currency market or the futures market. But then, there are also far less formal markets, such as a yard sale or craigslist or even kids trading baseball cards (or any sort of cards) on the school yard.

The purpose of my survey was thus to verify whether informal markets had the propensity to lead to individuals partaking in formal markets. The particular type of informal market that I studied was the last example that I gave, that of young children trading cards with one another, and the formal market that I hoped to correlate these findings with was the stock market.

The underlying theory that gives me reason for this connection to exist is based on socialization. Sociologists use this terminology in order to describe the "process of learning one’s culture and how to live within it" (Source). I think that bartering is a human behavior that individuals must learn in order to survive. Therefore, I gathered that if individuals were exposed to market environments at a younger age in an informal setting, they may be more likely to participate in markets when they are older through socialization and conditioning.

It also may be more natural and intuitive for individuals to participate in formal markets when they have already taken part in informal markets.

That was the first objective of the survey I gave. The second objective was to seek out something far more psychological about the thought processes of individuals partaking in formal markets based on their socialization from informal markets. I sought to find whether or not individuals were likely to hold similar beliefs about the value of items with the influence of time.
  • Results
The results are based on the survey results of 34 respondents. 19 of the 34 (56%) of the respondents were male and 15 of the 34 (44%) were female. The average age of a respondent was 22.6 years and ranged between a low of 19 years and a high of 42 years.

The first thing that I wanted to know from my survey participants was whether or not they had ever collected any sort of trading card. 65% of individuals (22 of 34) said that they had collected some sort of trading card.

Then I wanted to see whether the intent of the individual collecting the trading card was similar to the intention of formal market speculators. The way I did this was to ask whether the individual when collecting their trading card anticipated selling that trading card at a later date.
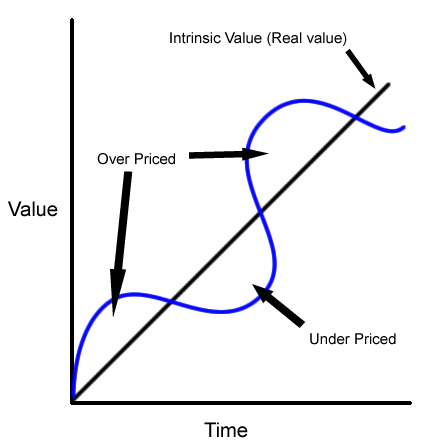
The answer to this question reveals a great deal about human behavior psychologically and culturally. A high percentage of individuals willing to sell their trading cards at a later date indicate that people instinctively collect belongings recognizing that they will part with them at a future date. This seems odd doesn't it? If I know that I am going to have no use for a particular item in the future, what is my motivation to horde that item now? I think intuitively it comes down to exclusivity.

When an item is highly desirable and highly exclusive the value of that item is inflated. This isn't because the item itself has gotten any better, but rather, the psychological drivers of desirability and exclusivity make an individual perceive a particular item to be more than it is worth. It is based on this premise that people will opt to collect items today in hopes that their perceived value will be greater later on (in effect, attempting to horde an item that has "stable" value, money).

Of the surveyed individuals, 63.6% (14 of 22), anticipated selling their trading cards at a later date.

Next, I wanted to figure out what those individuals who anticipated selling their trading cards at a later date thought would happen to the value of their trading card over time. I gave them the option of the value increasing or decreasing over time. A staggering 100% (14 of 14) believed that by adding time to the equation, the value of their item was surely to increase.

This reveals something quite compelling about the natural tendency of individuals partaking in informal markets. It illustrates that perceived value over time increases. If this is instinctive in informal markets, can the same be said about the value over time of objects in formal markets? If the socialization effect appears to hold, this could be a reasonable deduction to make.

Now, I began my inquiry into the interaction with formal markets of our surveyed participants. I asked respondents if they had any capital invested in the United States stock market (our formal market).

Out of all respondents, only 38.2% (13 of 34) had money currently invested in the stock market as of May, 2009. According to 2002 data by the Investment Company Institute, 35.9 million households, which represent 33.7% of the households in the United States owned either stocks or mutual funds or both (Source). Based on the close proximity of these two percentages, I can conclude that we are looking at a pretty representative sample of the United States stock ownership community.

This is where I can finally get at what I was really after. At this point, I can determine if there is a significantly higher percentage of individuals who traded cards when they were younger (in informal markets) who participate in the stock market (our formal market).

In order to perform my statistical tests, I used a one-proportion z-test for the four particular conditions that I had. The first condition was yes informal - yes formal (YIYF), the second was no informal - no formal (NINF), the third was yes informal - no formal (YINF), and the fourth was no informal - yes formal (NIYF).
  • YIYF
After conducting the one-proportion z-test for this condition, a z-value of 0.55 was achieved which has a p-value of 0.2088. This is not considered a statistically significant value, and thus one cannot conclude that if an individual was involved in informal markets then that would predict for their involvement in formal markets. (A larger sample is needed to truly verify this result).
  • NINF
A z-value of 3.4 was achieved which has a p-value of 0.0003. This is considered a highly statistically significant value, and thus one can conclude that if an individual was not involved in informal markets then that would predict for their non-involvement in formal markets. (A larger sample is needed to truly verify this result).
  • YINF
A z-value of 2.27 was achieved which has a p-value of 0.0119. This is considered a highly statistically significant value, and thus one can conclude that if an individual was involved in informal markets then that would predict for their non-involvement in formal markets. (A larger sample is needed to truly verify this result).
  • NIYF
A z-value of -0.59 was achieved which has a p-value of 0.7224. This is not considered a statistically significant value, and thus one cannot conclude that if an individual was not involved in informal markets then that would predict for their involvement in formal markets. (A larger sample is needed to truly verify this result).

These findings truly get at the crux of the survey. It appears as though there is no correlation between involvement in informal markets and formal markets.

The survey also sought to verify whether the beliefs held about perceived values were still consistent between informal and formal markets. Recall that in informal markets individuals believed, with a 100% success rate, that the value of their good would increase over time. When it came to formal markets, it appears as though beliefs mirror that of the informal market. 92.8% (13 of 14) respondents believed that the value of an investment is likely to increase rather than decrease over time.

This seems to be highly correlated. Beliefs seem to remain embedded regardless of the market type, and that belief is that value increases over time.

With the belief structure that value tends to increase over time it was not that surprising to find that only 59% (20 of 34) of respondents knew the difference between a long position in the stock market and a short position. Long positions are based on the belief that investments will increase, whereas, short positions take the stance that investments will decrease. A short position is probably counter-intuitive to a lot of people's thinking based on the results of this survey.

Thanks to all participants!

Tuesday, May 19, 2009

Thompson Creek Metals Company, Inc.

I have just started utilizing a new trading strategy that is based on a study done at a highly accredited University based somewhere on the planet. Based on the study's findings, my own investment knowledge, pure intuition, and good old fashioned luck, I thought that I would start blogging about some of the ideas that I have on this front. I guess it is a little bit of a risk putting my stock ideas down in writing due to the fact that both you (hopefully there is someone out there) and me will know if we got the stock pick right.

I will also let you know that if I will never blog about a particular stock I am invested in. This doesn't necessarily mean that I will never invest in the stock, but I think that my own portfolio is my own business.

Anyway, the first stock that I am going to pick is Thompson Creek Metals Company, Inc (TC). As of May 19, 2009 at market close it is currently trading at $9.00. It has just had an incredible day as well, but that is hardly why I am pitching it. I'm actually going to first make a case why the buying price right now is overinflated and that if you're wise you will wait to it pulls back before getting in.

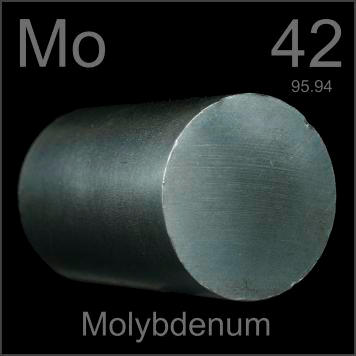
First, a little about the company. According to Google Finance, "Thompson Creek Metals Company Inc. is a Canadian molybdenum mining company with vertically integrated mining, milling, processing and marketing operations in Canada and the United States."

Okay, a couple interesting things to point out here. First, they are Canadian. That means that they are subject to Canadian laws and all that jazz. Second, they are a mining company that mines this substance called molybdenum. Excuse me, molybdenum? After further analysis, I learned that molybdenum is a pretty incredible substance.

If you're familiar with the Periodic Table, it is atomic number 42. The applications of molybdenum is really what we're interested in though, seeming though a company's livelihood is contingent on its usage. Molybdenum is able to withstand extreme temperatures, which make it helpful in "the manufacture of aircraft parts, electrical contacts, industrial motors, and filaments" (Source).

They have plants in Northwest Canada, Idaho, Colorado, and Langeloth.

What drives me to pick this stock is based on the following. Although we're in a recession, molybdenum is a substance that is necessary to the ongoing growth and expansion of the world. And, as the world becomes more globalized, we're finding it easier to transport materials for usage. With that in mind, consider China and India. These two countries are still going to develop a great deal over the next 20 years and they are going to need molybdenum in order to satisfy their growth needs.

TC also happens to be one of the world's largest producers of molybdenum. When you consider anything in the world that is the largest (outside of economic collapse), these companies tend to perform very well because they have a solid foundation and are able to use those economies of scale very nicely. They have an entrenched network that can grow rapidly as well, so when this recession does come to an end they will be first movers.

TC was also hit badly by the economic downturn. They fell all the way to $2.44 before starting to recover. It would have been nice to get in that low, but there's a saying and it goes, "woulda, shoulda, coulda."

TC has been on this ascent since November, 2008 and has shown that they're a solid company that was hit hard by a psychological attack on the market (see Robert Shiller for further information). They're recovery over the past month, however, has been far too rapid (they are up 70%).

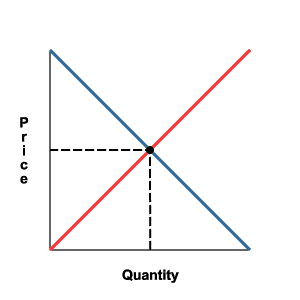
My grandfather explained to me that as the market goes up it also has to come down. The reason for this is primarily profit-takers. Think about people who got in at $2 or $3. They're ready to cash out, because they've tripled their profits. The greedy ones will be hit hard though. Due to the fact that the stock market, like any market, is reliant on supply-and-demand, a percentage of share owners will leave the stock creating an overall increase in supply and further downward pressure.

You may notice that I'm not referring to any sort of Stochastic Indicator when I walk you through my reasoning. The reason being that I look at the stock market as a market like any other. People have just had a little too much time on their hands over the past 150 years to create these mathematical models that, I would contend, got us into the current mess we are now. If we are just conscious and think about our reality, it starts to make a great deal of sense.

One metric that I do focus on is the P/E ratio. This is one of the only financial metrics that makes valid sense to me. It takes the price of the current stock and normalizes it based on its earnings. Stocks that have lower P/Es typically outperform stocks with higher P/Es (see Irrational Exuberance - Shiller). TC has a P/E of 8.28 which is ridiculously low. This reveals to me that their stock is trading at a premium.

However, as I mentioned earlier, the stock is overinflated and needs to come down. It is hard to say what it will come down to exactly, but at the current price, I wouldn't buy it before it got down to at least $7.50. At which point I am a buyer and in for approximately 3 months or until my pockets get full enough for me to be happy. This stock has high momentum and so I wouldn't be surprised if it went down to $7.50 and up to a price objective of roughly $20 by the end of 2009.

There you have it.
TC - Thompson Creek Metals Company, Inc.
Current Price - $9
Recommended buy at - $7.50
Price objective - $20
Investment time - 3 months or until the end of 2009 if slow

Wednesday, September 3, 2008

Have You Ever Wondered if Volume and Percent Stock Change Correlate?

I thought about an aspect of the stock market this evening that I thought I'd quickly decipher for myself, and my devoted blog readers. It appears as though every time I look at a stock that has a small volume, there also appears to be equally negligible movement in the stock. As a result, why would anyone want to invest in stocks that have volume of 10,000 or less; it wouldn't make sound sense. However, people invest in stocks regardless of volume. I wondered why nobody really cared about the particular volume of a stock and why this isn't a determining factor when firing off a trade.

By looking at the opening and closing prices of every single stock on the New York Stock Exchange on September 3rd, 2008 (3,243 current listings), I was able to determine the association that volume of a stock has with percentage change.

I had to locate every stock on the New York Stock Exchange for an assignment at school, and obviously with such a surplus of information, I did a lot of cool things with the Excel document that I found. One of them was to determine this correlation.

In order to figure this out, I merely performed the equation for percentage change, (New-Old)/Old. So in our case that would be (Closing Price - Opening Price)/Opening Price. By graphing these two variables on the X and Y axis accordingly, one is able to determine an association between the two variables.

The best association between two variables equals 1.00 after performing a regression analysis that Microsoft Excel takes care of when adding a trend line for a given data set. 1.00 represents that the X and Y coordinates create a perfect line together. On the other hand, a regression analysis of 0 indicates that there is absolutely no association between the variables and is typically seen as a haphazard cloud of points completely in disarray.

Based on this information, we can analyze just how close the relationship is between the two variables.
  • Results
As the graph above indicates, based on the data accumulated (courtesy of EOData.com), on September 3rd, 2008 the New York Stock Exchange had a 0.0322 r-squared value describing the association between volume and stock percent change.

This is a tiny number and unbelievably close to 0, which is indicative of little to no association between these two variables. As you can see, the points look like a cloud of information with some random outliers. If the correlation between these two were stronger, one would see the points follow the linear trend line inserted in the graph.
  • Conclusion
Although further sample days are probably needed, I think the association between volume and stock percentage change can be put to rest. While I may encounter stocks with low volume having low or no percentage change at all, there is absolutely no rule of thumb for these two variables.

A stock with high volume may have a low percentage change, while the exact opposite of a stock with low volume might have high percentage change. Both statements are unavoidably the case based on empirical research done on September 3rd, 2008 for the New York Stock Exchange.

Monday, July 21, 2008

Simply Syntroleum

I'm a big fan of the stock market. I enjoy following its movement, the stories behind the companies, and the people involved. I'm not sure what has made me the avid stock fiend that I am today, but I thought its a combination of a love of numbers, money, and suspense. The stock market has all of these bundled into one happy little 6 and a half hour session, typically five days out of every week.

For more esteemed reasons, I enjoy partaking in the stock market because it keeps me informed as to the pulse of the American economy. The American economy is a significant, if not the most significant player in the whole world when it comes to the economy. The stock market is a barometer of where America's economy is and by virtue of its power and enormity, where the rest of the world's economy is likely to head.

These are all fascinating things. I also find the ways in which stocks are picked just marvelous. There are two particularly different trains of thought that I'm aware of. The first is fundamental analysis, in which stock brokers and institutional investors (you know, the guys who all had to writedown billions upon billions of dollars in wake of the sub-prime mortgage crisis, which I read totaled a whopping 12 trillion dollars (92% of US GDP)) look at financial data for publicly traded companies and make judgments based on the current economic climate.

They take factors like the balance sheet and income statement into account, as well as, management practices. I'm a huge proponent of looking at management practices. I believe that with the right team and suitable actors in the correct places, a capable management team can make even the most desperate company rise from the depths.

Anyway, another way to look at stocks is through the lens of technical analysis which emphasizes the stocks historical data as it relates to price and makes its judgments based on these metrics. I've always loved deciphering charts and trying to gain a further understanding of them especially for various stocks in the market.

Recently, I've become enthralled with a particular type of technical analysis called Point and Figure Charting, which you can read about on Those Answers Inc. website. The main idea behind it is that it charts the price movement of the stock in terms of supply and demand, the main driver underlying all economic thought. Simply by creating a vertical column of X's or O's, a tremendous deal of information can be gathered about the buying or selling habits of a particular stock.

Another nice feature about it is that it doesn't take time into effect, which can often distort the movement of stocks. On the surface, Point and Figure Charting may look very simple, but there is a tremendous amount to it that has fascinated me and led me to one of the best looking and most promising stocks I can see available at the moment.
According to Google Finance, "Syntroleum Corporation is engaged in developing and employing technology to produce synthetic liquid hydrocarbons that are free of contaminants normally found in conventional hydrocarbon products. Syntroleum’s Bio-Synfining Technology processes triglycerides and/or fatty acids from fats and vegetable oils with heat (thermal depolymerization), hydrogen and catalysts to make renewable synthetic fuels, such as diesel, jet fuel (subject to certification), kerosene, naphtha and propane. Syntroleum has quantified in excess of 80 different fats and oils, for conversion to synthetic fuels via the Bio-Synfining Technology, which is a flexible feedstock/flexible synthetic fuel technology."

In a nutshell, Syntroleum has developed a new and special technology that is capable of creating diesel fuel using fat. This means, that instead of using corn to make ethanol gas, which ends up hurting us either way because then it makes corn really expensive, we can use the stuff we don't even want in the first place, fat, to make fuel through this incredibly innovative and breakthrough technology.

I have never felt a stronger buy in my entire life. I first saw this stock when it was wallowing in the sub $1 range, almost being thrown off of the NASDAQ, because it just couldn't keep up with regulations. Since then it has returned in excess of 400%. It is currently at $2.24 a share and shows me no signs of slowing down whatsoever.

Let's get back to the process though. They make diesel fuel. This is spectacular for several reasons. First, the price of diesel fuel, along with petroleum, has skyrocketed recently (I believe the price of diesel fuel has actually outpaced petroleum percetage-wise). This spike in prices has begun a paradigm shift to move away from oil and to some sort of alternative energy.

Last summer, the push to alternative energy happened with solar energy. Companies like First Solar (FSLR) grew impressively. Their stock is now trading above $200, up from around $5 early last year. Different alternative energies are getting their shots, its just a matter of picking the right company. There are several other solar energy companies that did not see the massive gains that First Solar did (however, they were still sizable).

With these high oil prices and no one really knowing when they will ever come down, alternative energy, especially that which produces diesel fuel, is ripe for investing. People want to believe in an alternative energy source, and Syntroleum seems to continually have the answer.

For instance, their Bio-Synfining Technology needs fatty acids in order to occur. So, Syntroleum has recently struck a partnership with Tyson Chicken, the largest chicken farm in the World (#88 on the Fortune 500 List), to use all of their chicken fat. Not only does Syntroleum have the greatest supply of fat on the planet, but it is an unending supply.

Chicken fat, or any sort of animal fat, is completely renewable. There is no end to how much of this stuff we can use, and for the most part, there aren't many other uses for chicken or animal fat, so this takes something worthless and makes it pure profit. Pure genious really.

But heres where things really get good. Syntroleum and Tyson, their joint-venture called Dynamic Fuels LLC, just received $100 Million worth of GO Zone Bonds. GO stands for Gulf Opportunity, and is a program that was established post hurricane Katrina by the State of Louisiana. The bonds are tax exempt are meant to promote investment in the area.

In late June, Dynamic Fuels LLC was approved for $100 Million, the maximum amount paid out in the program. Their plan is to build a synthetic fuel facility in Geismar, Louisana by 2010.

This was well received by Jeff Bigger, Senior Vice President of Business Development at Syntroleum, "We thank the Bond Commission for their decision to approve this application. Their timely action enables us to maintain our project schedule, creating new domestic fuel production capacity, high-quality operations and technical jobs, with initial production planned for early 2010.

Everything is going absolutely right for this company. What's more is that now that it's above $2, stock brokers are legally allowed by the SEC to promote this stock to investors which will drive the price up as demand increases. As the price goes up, mutual fund managers will want to add this stock to their portfolios, and several institutional investors have already added Syntroleum, Goldman Sachs, Vanguard, Scott and Stringfellow Financial, etc.

On July 22nd, 2008, Syntroleum plans on holding a conference call for investors to discuss all the positive news that has been circulating around this company of only 24 employees. They will probably make reference to the GO Zone Bonds, Dynamic Fuels LLC, their joint-venture, and the approval of their synthetic fuel plant in Geismar, Louisana.

Syntroleum seem to be on the right track. They've got the capital they need, they have a mammoth partner on who to piggyback, an original technology that makes one of the most sought after commodities, and plans to build a facility in which all of this wonderful Bio-Synfining can occur. All this company spells out to me is growth and profits, over and over.
  • Conclusion
At $2.24, Syntroleum is not only a buy, but highway robbery if you can steal it at this price. Over the next 12 to 18 months this stock is going to explode. They have the technology, capital, and partnerships they need all necessary to create a profitable endeavor.

What's more, the economic climate is just right at the moment. Oil prices are surging. People are looking for alternative ways to create energy and seeking out those that are the wisest investments.

Syntroleum has taken the necessary steps to get them to where they are, and I feel as though they will continue to meet and exceed the market's expectations.

If stock price is indeed the perceived future valuation of a company, Syntroleum truly has no limit. Happy investing!